Wednesday, June 29, 2005

Mid year posting S&P 100

I've started to experiment putting charts in this blog so be patient during my growing pains.
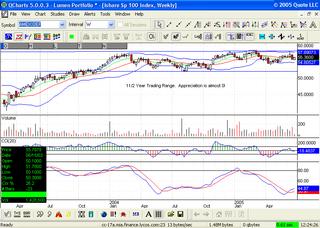
A picture is worth a thousand words and this is a 2 year chart of the Ishares S&P 100 index.{Symbol OEF} It is a proxy for the OEX index which is made up of the top 100 stocks in the S&P 500. It has almost 0% appreciation since January of 2004. In fact without a positive return in energy related stocks it would probably have posted a negative return in this time frame. {Note: you can click on the chart to enlarge it.

*Mr. English and/or clients of Lumen Capital Management, LLC hold or have held postitions in OEF. Although positions are subject to change at any time.

Thursday, June 23, 2005

NBBT Alert

It looks like I'm not the only one who has noticed the earthquake danger lurking in the midwest. :{
http://www.livescience.com/forcesofnature/050622_new_madrid.html.

A good illustration on its effects can be found here. The included map shows the effects between two similar earthquakes: The 1994 Northridge quake and a similar magnitude quake in 1895 centered near Charleston, Missouri within the New Madrid Zone. The Northridge trembler killed 33 people and caused an estimated $20 billion in damages. A similar quake in Kobe, Japan in 1995 killed 5,500 people and caused an estimated $100 billion in damages.* In the map, red indicates minor to major damage to buildings and their contents. Cities in or near this red zone include: St. Louis, MO; Memphis, TN; Nashville, TN; Evansville, IN; Indianapolis IN; Louisville, KY; and Cincinnati, OH. Yellow shows the geographic area in which the earthquake was felt.
http://quake.wr.usgs.gov/prepare/factsheets/NewMadrid/Charleston1895.gif

We now send you back to your regular programming.

*Source: http://quake.wr.usgs.gov/prepare/factsheets/NewMadrid/

Friday, June 17, 2005

It's A Big Country

Remember we recently listed the rising prices of homes as an NBBT (The Next Big Bad Thing). Here as best I can figure are the two things that concern the experts. 1. People are using their homes as a piggy bank, refinancing out their rising equity for personal use. This is supposed to be a bad thing. It is supposed to be bad because at some point when prices stagnate or quit going up the homeowner will be faced with either less equity or at the very least will not be able to continue going to the home banking well. Also the homeowner will have built up no equity over time in this scenario. 2. The combination of rapid appreciation in home prices plus the access to easy credit has led to a financial bubble in housing that in the eyes of many financial gurus is unsustainable.

Let’s take the 2nd of these issues first and on the onset let’s also stipulate that I’m no expert on real estate. That being said, I don’t doubt that you can look at parts of the country and find overheated aspects of housing. And I also don’t doubt that at some point the music will stop for those people that I constantly hear about on TV who are flipping condos that haven’t been built yet. But I don’t know if the music stops tomorrow or next year. I also probably won’t know at the end whether these flippers will have done it enough so that in the aggregate they will have made money. I do know that when the "bubble bursts", the press will only tell us about the unlucky Joes who went down in flames.

One of my early mentors used to say "it's a big country" when he'd see some generalization about issues like housing in the press. Well it is a big country! A lot of people live in its middle and an awful lot of that property hasn’t experienced the kind of growth seen on the coasts or in places like Las Vegas. My guess is that housing five miles inland from Miami Beach hasn't seen the same kind of appreciation either. Or take my home town of Union City. I doubt that there are more than two houses there that would sell at a price north of $200,000. Some digging on the web well tell you that the median home price in a place like Lafayette Indiana is currently about $204,000*. Now that is still up 15% in the last 12 months but hardly seems to be the kind of runaway pricing I’m constantly hearing about.

Now about those people using their homes as a piggy bank. Let’s start off by saying that the family who refinances every 2 years so they can go to Disneyworld or go on some sort of preternatural shopping spree is not doing a good thing in the long run. Everybody knows somebody like this. They also happen to probably know the family that refinances to put a child through college, pay off bills or remodel their homes which generally has the effect of adding to its value. At the end of the day it’s going to depend on why people are taking the money out. Each case is different.

Finally let’s look at the appreciation of housing and do some math. Let’s use Lafayette, Indiana again. Let’s say that the fellow that owns that home worth the median price bought it 8 years ago for $100,000, putting $30,000 down. 4 years ago with his house worth $140,000 he refinanced, taking $35,000 out. $25,000 went into some remodeling and $10,000 paid off some bills. This year with his house basically worth $204,000 he is refinancing again. He wants $20,000 for college tuition. What irrational choice has this gentleman made? Especially since equity interest rates are currently lower than most other forms of credit and the interest is potentially tax deductible.

As for appreciation (the same home using only one refinance and we’ll say for fun that his return on the $35,000 he originally took out has helped his appreciation on a 1-1 basis). Note: I'm trying to keep this simple so there are things like his income and the effects of property taxes I'm leaving out.
$204,000
-$100,000 Purchase Price
- $35,000 Refinance
- $8,000 ($1,000 x 8 years annual maintenance on the home.)
$61,000 is his profit.

On average the house has appreciated a little better than 7½% a year. Not a bad return (and I do understand that the leverage from his mortgage has made his personal return higher), but not shoot the lights out money.

We’ll discuss the investment implications of this soon.


*Source: realtytimes.com ,June 17, 2005. The actual median price is $203,800.
Thursday, June 16, 2005

Summer Hours

My goal has been to try & post something here every 2-3 days. I think that schedule is a little unrealistic over the summer. My goal is to do a major piece at least once a week. I will try to post either on Friday or over the weekend. I will write something at other points if events should warrant or I have a spare moment to throw out an idle comment or two. Here are some of the stories and issues I want to cover in the following months. At some point I will finish my 19 year history in the business and then follow up on what lessons I have learned during that time. I want to do a series on portfolio construction and the growing importance of Exchange Traded Funds {ETF's}. I want to discuss market volatility and how it affects investors. In conjunction with volatility, we will discuss investor psychology. I will also walk you through the steps as to how I manage money for the clients of Lumen Capital Management. Also we'll revisit our old friend social security, talk about the world economy and try to highlight some new investment trends as they come forward.

Finally please let me know if there is something you all would like me to cover. I will do a Q & A session at some point to go through some of the more common questions I've received.

Chris

Wednesday, June 08, 2005

Pondering

Things to ponder while taking a break from the midday heat. Summer came early to Chicago this year.

-CNBC is reporting that mutual funds experienced their strongest inflows since February of this year. That's just before the SPX experienced a nasty 7% pullback and the NASDAQ fell over 8%.*
-Investors Intelligence shows 50.6% of its respondents as bullish {thinking stock prices will go up} & only 20.9% bearish {thinking stock prices will go down}. This is historically seen as a contrary indicator.
-Speculative media darlings getting killed right now.
-See my June 1st post.

*CNBC, Power Lunch, June 8, 2005.
Please note market information is for informational purposes only. Unless you consult with Mr. English and he understands your investment profile, you act on information contained in this post at your own risk.

Tuesday, June 07, 2005

The Next Big Bad Thing

Today's trivia question: Who's ever heard of the Reelfoot Rift? Answer to follow.

I'm always amazed how everybody but me knows what the next big bad thing {NBBT} will be. I'm talking here about the next horrible event that either the media, Wall Street or the Federal Reserve says will bring dire effects to the markets, the economy or both. I thought for the fun of it I'd list a few that come to mind starting with the ones that have been around for years.


First there's the consumer. He or she is always spending too much money or not enough. My take is that the average family has a better idea about their checkbooks than most economists want to give them. This also is tied into the national angst about our low savings rate, although why people are going to be excited about investing in assets paying less than 2% is beyond me. A cousin of the consumer is anxiety related to monthly unemployment numbers. Either too many people have jobs and therefore interest rates have to go up or more are being laid off thus ushering in fear about a slowing economy. We also can add to this list of worries the current price of oil.
Next there's the deficit-State & Federal-but since nobody really knows how to define it or how to measure it against the nation's net wealth it's hard to get our hands around its actual effects.
Then rounding out the perennial list is Social Security (one of my concerns as noted in earlier posts) but not a problem that will likely affect the overall economy in the next 2 years.

To this list we can add worrisome current fads.

Hedge Funds-(usually shorthand for private limited partnerships) I'm not really sure why they raise the bile of the press.
The cost of housing. The financial press chatters incessantly about this. We may or may not be in a housing bubble in parts of LA, Boston, Chicago or Miami. My guess is I could find all sorts of places in the country where prices haven't shot to the moon. Besides I can take you to areas of Chicago & Miami that have missed the housing boom.

These things are all areas to be concerned about and certainly should not be ignored. But they are probably not NBBT. The reason being that we are already on guard for these events (or things just like them) and they are eventually discounted into share prices. Yet way too much ink is spilled and airtime wasted covering NBBT. You want proof? Watch an hour's worth of CNBC and I'll guarantee you that they will devote at least one segment to any of the above mentioned stories.

There is a NBBT out there though. Unfortunately I don't know what it is and you probably don't either. There will always be NBBT. It may be in its genesis phase at the moment or it may be festering underneath the surface close to exploding. Portfolio insurance was part of the 87 market crash's NBBT. Iraq's invasion of Kuwait was the NBBT of 90-91. LTCM was the NBBT of the 98 financial crisis and we're still dealing with the repercussions of the ultimate NBBT, the 9-11 attacks. (A subject of a future post.) NBBTs are events that are either impossible to game into the system (meaning it is almost impossible to discount the risk and result of some hypothetical event into security prices) or they are considered so remote as to be beyond the realm of current possibility. Stocks for example don't discount a large asteroid vaporizing the earth from space in the near future. They probably do to a certain extent discount future terrorist attacks.

Here is the kind of thing that is NBBT which gets me back to our trivia question. The Reelfoot Rift, A.K.A. the New Madrid Fault is a crack 3-15 miles under the earth tracing a SW-NE line between St. Louis and Memphis. It caused in 1811-1812 a series of earthquakes estimated to have been stronger than the tremblers that rocked San Francisco in 1906, Loma Prieta, San Francisco in 1989 and Northridge, California in 1994. The average of these 3 was 7.5 on the Richter Scale. New Madrid's series of quakes is estimated to have been north of an 8.5. The geology in our midwest is different than California so an earthquake here would be felt far from its epicenter. The 1812 quake which is estimated to have been a 9.0 on that same scale, was felt as far away as Boston and changed the course of the Mississippi River for a time. Its history is largely unknown because it happened when few people lived in the area. By comparison, the Sumatran quake that spawned last December's tsunamis was a 9.0 The death toll from that event is over 300,000.

Most of the lower midwest isn't constructed to withstand a similar event even though there is a greater awareness about earthquakes today. A 9.0 event in this area would have the potential to be the greatest natural disaster ever recorded in the US and would be economically devastating. The loss of life could dwarf anything witnessed in modern American history. But here's the rub. New Madrid might bounce tomorrow or in 10,000 years. You can't go to ground and wait for an event that may not occur in your life.


So as investors we have to understand that NBBTs happen just as the media loves doomsday stories. They don't have to be as extensive a scenario as I've described. But the ones incessantly talked about today are probably not the ones that will cost you money down the road. And there's nothing we can do right now to plan for the ones that will. Because I don't know what the next NBBT will be....and neither does anybody else.

Saturday, June 04, 2005

19 Years-Stalling Out.

For a variety of reasons the markets stalled after it reached its March highs. A casual observer looking at the SPX would have concluded that stocks were going through a digestive phase. This could be seen as a pause similar to other times during the long boom when prices took a rest before continuing higher. With the exception of 1998 and LTCM, stocks had experienced no meaningful downdraft during the 1995-1999 run. It appeared no different this time. The SPX was trading around 1480 six months after its all time high, lower by about 5% from that March 1552 print. But, the real carnage was taking place under the surface in the speculative sections of the market. Now let's first point out that the so called “old economy” companies {which had themselves appreciated quite nicely during the bull market} had not seen anything like the speculative leaps enjoyed by many smaller companies involved in technology and internet communications. The air was let out of many of these stocks as the markets for their services dried up or came to be seen as never as extensive as they had previously hoped.

CMGI, the Waltham, Massachusetts distributor of supply chain management services to other technology companies, is a good example to use. CMGI’s stock had traded below $1.00 in late 1997 and by December, 1999 printed a high of 163.22. General Electric {GE} would have gone from $21 to $3,428 if in the same time it had experienced this same sort of percentage appreciation. CMGI traded as high as 151 in March, 2000. By May it traded in the 40’s. A year later it traded at 4. It currently trades around 2. Many other companies went out of business or had to de-list from the exchanges. If the market itself had its largest declines after the “87 Crash”, then probably the largest flameout since that time hit these speculative companies in the 2nd. quarter of 2000.

The SPX rolled over and started its decline in the fall of 2000. At first this was seen as largely seasonal and due in the main to the uncertainty regarding the upcoming presidential election. The SPX lost about 15% between the late summer and Election Day. But the nation woke up on November 8 to the fact that it had no President and the events of the next several days indicated there would not be one in the foreseeable future. Markets hate, absolutely hate, uncertainty and next to a war this was the one of the murkiest of all outcomes. Stocks had no buyers. Prices fell another 12%. The market lost almost 20% from its March highs to its late December lows. As mentioned above it went worse for other market sectors.

Even with the election resolved the market continued downward as a slowdown in the US economy became more evident. Corporations had spent aggressively to upgrade their systems in the late 90’s and were in no mood to continue the binge in an era where their own bottom lines were being pinched. Economically, the new Bush Administration seemed to be getting off to a slow start. His economic advisors were seen as weaker than those picked by the previous Clinton Administration and his razor thin majority meant he was seen as a weak President in terms of any agenda that he might have.

It was against this backdrop: an already declining economy, a perceived weak Bush Administration and a market that had declined 12 out of the past 17 months, that the September 11, 2001 attacks in New York and Washington must be seen.

The outside world might refer to those of us who invest in the financial markets as working on Wall Street. Insiders mostly refer to our profession as “the business”. It has been my experience that those of us in “the business” place a divider between the world we knew prior to September 11 2001 and that which has evolved since. I believe that the investment world changed irrevocably after 09/01/01. It is going to take me more posts to detail how that is so. But we’ll start to bridge that divide in the next part of this series. To be continued……..

*GE is currently owned by Time Warner (TWX). Mr. English and some of his clients currently hold positions in TWX although said positions are subject to change at any time. No current positions in CMGI although positions are subjedt to change at any time.

Wednesday, June 01, 2005

May Scorecard

The major indexes had a good month. The S&P 500 {SPX} was up over 3%. The Dow Jones Industrials {DJIA} was the laggard up just a little over 2.6%. The Nasdaq was the star, gaining almost 9%. According to CNBC, the SPX had its best month since December of last year and the Nasdaq had its best performance since October of 2003.*

However these major averages are still lower than where they started the year. Again according to CNBC the Nasdaq is still down almost 5% while the SPX is off about 2%.*

Only the SPX has managed to move ahead of its early 2004 highs. Even then the SPX has only managed to return a miserly 3% over these past 15 months (excluding dividends). In contrast the Nasdaq is lower by about 3% during the same period.

The market has started June off with a flourish due to positive comments on interest rates this morning out of a Federal Reserve Governor. Also monthly cash inflows {new money into mutual funds from retirement plans} is probably helping push us higher today.

Notwithstanding today's events, there is a higher probability that stocks will experience either a pullback in prices or some sideways movement in the next couple of weeks. After a strong May in which many stocks experienced almost parabolic upward moves, they would need some unlooked for catalyst to give us appreciation similar to the last 30 days. Not impossible of course, just less likely.

I am still comfortable with my early May post~ that the markets will at least be somewhere close to their breakeven mark for 2004 by the end of the month. Then we shall see what the rest of the summer might bring.

More on this later.

*CNBC, Morning Call, June 1, 2005.
~"Where We Are", Solas, May 1, 2005.
Please note market information is for informational purposes only. Unless you consult with Mr. English and he understands your investment profile, you act on information contained in this post at your own risk.