Friday, January 31, 2014

Things Are Getting Better {Deficits & GDP}

Today we'll continue our review of the economic date.  Nationally note that the economy continues to expand and our deficits are shrinking.

Federal Reserve estimates of GDP growth.


Gross Domestic Product is at all time highs.


Federal deficit while still too high on a sustainable basis has shrunk dramatically.  This chart shows the deficit as a percentage of Gross Domestic Product.


*Data comes from the St. Louis Federal Reserve.  You can double click on the charts if you want to make them larger.

Asset Allocation


Mebane  Farber takes a look at asset allocation looking at a broad base of ETFs.  My calculations show that an equal calculation to each would have produced about a 6.20% return last year.   US stocks obviously shot the lights out in 2013.  Almost everything else though had a decidedly mixed return.  

It is tempting to think that in a year when stocks rocketed to the moon that everything should have been in that asset.  However, I'd note that nobody thought last year that US stocks would do anywhere near this well. The reason most investors should have an asset allocation strategy is outlined in the chart of asset classes below.


Hard to know which asset class broadly speaking will be the best year over year.  Note that a diversified portfolio as comprised by JP Morgan for this chart had returns nearly identical as the S&P 500 but theoretically did so with less risk.  

Thursday, January 30, 2014

Things Are Getting Better. {Housing}

We concentrate on housing and autos because they are huge employment and economic multipliers.  Today we show charts related to housing.  I know that the data has been weaker the past few months on this but I'd also point out that the weather in much of the country hasn't been real conducive to construction or to sales.  In Chicago for instance, we've had snow on the ground now for the better part of two months.  Actually it started snowing here early this year.  Like in Mid-November.  We've had more snow already this year than we usually get in an entire winter!

Housing prices have stabilized and started to move higher.


At the same time housing affordability levels are still attractive.


*Data comes from the St. Louis Federal Reserve.  You can double click on the charts if you want to make them larger.

Wednesday, January 29, 2014

Things Are Getting Better {Autos}

Below are charts on auto sales and trucks.

Here's automobiles:


Notice that auto sales are back to pre-recession levels.  Also note that autos have probably not been this affordable in years.  Those low rate or zero percent financing deals means that the cost of buying a car has declined by several thousands of dollars.  The price of gasoline stabilizing helps the average car owner's wallet.  Finally cars today are simply more fuel efficient.  I bought a new car this year that replaced our old mini-van.  It gets 33% more miles to the gallon in both the city and country.  That is almost the equivalent of a car payment every year in terms of savings.

*Data comes from the St. Louis Federal Reserve.  You can double click on the charts if you want to make them larger.


Tuesday, January 28, 2014

Things Are Getting Better. {Gasoline}


I never did make it to Florida for my conference.  The weather gods conspired to keep me here.  Two canceled flights in two days put the lid on the whole thing.  We'll continue our series of charts today on why I think things are getting better.  I think today this is an important perspective given what we've seen the past several days with the market's decline.   I think this current decline is more from the perspective of valuation than an issue with the economy based on what we've seen in the data.  Today we'll look at something that effects nearly all of of us, which is oil and gasoline.

The price of gasoline while volatile has remained between a range of $3.00-4.00 since around 2010.  I'm guessing if you took away taxes and environmental additives that the Government adds for ozone the actual cost to fill a car would have declined.


Miles driven has actually declined.


The amount of people employed bringing us all that new oil and gas has increased to levels not seen since the early 1980's.


*Data comes from the St. Louis Federal Reserve.  You can double click on the charts if you want to make them larger.

Saturday, January 25, 2014

Break In: Friday's Decline


I'm going to break in here before heading off to my conference and briefly discuss what I think has happened the last few days in the markets.  There are all sorts of explanations on why stocks have declined, many of them involving emerging markets.  If you're interested you can read about some of it here, here, here and perhaps the best explanation which is that all the turmoil may be one gigantic hedge fund short squeeze.  I think I like that the best because it may fit the closest to my interpretation of what's been happening.  I'll list my thoughts below.

1.  First thing to remember is the turmoil in emerging markets and certain issues at home like retail sales have been out there for awhile.  Stocks surged forward in December as investors scrambled to lock in their year.  All these problems didn't seem to matter until this week.  Now it does.  Stocks have  now basically given back that December melt up.  The S&P 500 {we show it's representative ETF, SPY, above} is down for the year now about 3%.

2.  Markets have been technically over bought by our work for some time.  We've started to see some cracks in that over bought level now but we are not any where near over sold levels in any of the time frames we follow.  That doesn't necessarily mean that stocks will continue a straight path lower.  Stocks can correct by time as well as price.

3.  Some are pointing out that the S&P 500 has broken down through its 50 day moving average for the first time since October.  I think it's less important that it broke this than how the market reacts to the fact that it happened.  More important to me is that the market has now moved back into the trading range that it created in November and early December.  We will see how it reacts to  these previous support and resistance levels for clues to future movement.  Because this is a less established range, there is a higher probability that stocks could move through its support.  By our work there's a stronger level of support around 1700 on the index.  If the decline has further legs then probability suggests that the 1700 range is the more likely level for stocks to find support.  That would shave roughly another 5% off of the index if it fell to those levels.  Please note that there is no guarantee that any of these events might occur or that any of my analysis is correct.

4.  I posted this on January 17th as part of a discussion regarding valuation:

Probability analysis leads me to think that we will see at least one decline this year in the market in the 10-20% range.  It's been a long time since we've seen something like this.  Probability suggests that since normal market volatility is somewhere close to 10%, it is reasonable to suggest  that we could revert to the mean at some point this year.

While there is no crystal ball that will tell us how low we could go, investors shouldn't be surprised that we are seeing some sort of correction.  Trading in the 1,800's meant that the S&P 500 had very little valuation "give" in the event something spooked the herd.  When the "risk off" moment came this pillar wasn't there.  Sometimes it's simply time for the markets to go down and that's a pretty large run up in prices we saw last year.  While we don't know for certain where this might take us, one thing that is certain is that the tone and character of the markets have changed in 2014.  Volatility seems to be coming back.  Investors are not fond of it but we need it at certain times for markets to find their balance.

5.  My own longer term view is that economic growth here in the US is strong enough for stock prices to advance.  It may not be in a straight line like we've seen 2012 and the past few days may be telling us that the markets need some time now to consolidate those gains.  But looking out at the bigger picture and for reasons I'll discuss in my upcoming client letter, I think the foundations have been laid for stronger economic growth in the next few years.  Stronger growth also suggests that stock prices could advance longer term.  Stocks may not move higher right away and we may need some backing and filling now but from my perch and based on what we know today, probability suggests that declines {particularly if they allow the market to get over sold} should be bought.  I'll let you know if I change my mind about that.

*Long ETFs related to the S&P 500 in client and personal accounts.


Friday, January 24, 2014

Things Are Getting Better {Introduction}

Readers of this blog know that our prime thesis on a big picture economic basis is that overall things have been getting better for the US economy.  Note that getting better doesn't mean that things are perfect {hint:  they never are} or that we are close to solving many of our economic problems.  But overall we have made substantial improvements since 2007-2009 and the data bears that out.  Over the course of the next week or so I'm going to present visual evidence of that argument.  I'll start today and pick up Tuesday.  Also Monday and Tuesday I will be at the Inside ETFs conference in Hollywood, Florida.  I'll break in from there if something of merit needs to be posted here.

Data comes from the St. Louis Federal Reserve.  You can double click on the charts if you want to make them larger.

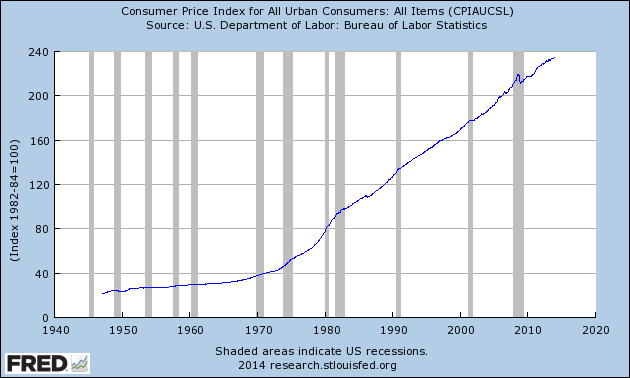
Inflation remains tame currently growing about 1.5%.


Interest rates continue to trade near historically low levels.  {Chart of 10 year Treasury.}


Update:  11.45, 01.24.14.

I forgot to post this chart on on debt service payments as a percent of disposable income.  See how it's dramatically dropped these past few years.


Thursday, January 23, 2014

Market Corrections

I noted on January 17th while discussing the market's valuation that probability would indicate we could see a market correction between 10-20% this year.  I noted in that post that it's been a long time since we've seen something like this.  The folks over at Business Insider via Andrew Lapthorne over at Société Générale quantified how long it's actually been in world by noting that, "it's been 408 days since the last 10% correction in the MSCI World index, the 8th-longest period on record."

Markets can obviously go for long periods of time without correcting and there's no law that says we'll see one anytime soon.  The real question may be whether when a pause or correction finally comes will it be one of price, time or a combination thereof.  Eventually stock prices are going to pause for something longer than a few days or weeks.   It's best to accept that fact and be prepared for it when it occurs.  Right now based on what we know of the economy, I'd be in the camp that any correction would be a buying point.  That opinion could of course change over time.  


*Long ETFs related to various world market indices in client and personal accounts.

Wednesday, January 22, 2014

an tSionna {Dow Performance}


Bespoke Investment Group takes a look at the Dow's performance through January as of last week:

"For investors who were looking for a repeat of 2013, 2014 has not gotten off to a very good start.  Yes, the slow start has been a bit disconcerting, but when you compare the performance of the DJIA since the start of December to its performance from December through January over the last twenty years, the current pattern is nearly a carbon copy of the 'typical' pattern.  If the pattern continues, look for continued weakness through next week before a rebound to close out the month."

My Comment:  Seasonal pattern of the past few years of the major indices getting off to a very strong start from the get-go in January has not held this year.  In some circles this is a cause for concern.  I think we need to balance that versus a market that was up so sharply in both 2013's fourth quarter and for December.  I think we "stole" some of this year's gains into that run up.   Time will tell.  


*Long ETFs related to the Dow Jones Industrial Average in certain client accounts.

Tuesday, January 21, 2014

an tSionna {Housing}


From Chart of the Day.com:

"For some perspective on the all-important US real estate market, today's chart illustrates the inflation-adjusted median price of a single-family home in the United States over the past 44 years. There are a few points of interest. Not only did housing prices increase at a rapid rate from 1991 to 2005, the rate at which housing prices increased -- increased. All those gains and then some were given back during the following 6.5 years. Over the past two years, however, the median price of a single-family home has trended significantly higher. More recently, the inflation-adjusted price of the median single-family home has declined and is now testing support of its two-year upward sloping trend channel."

My comment:  I think it is possible that new housing starts may finally top one million new units this year.  Housing is a huge economic multiplier and has the potential to be a major tailwind for growth in the next few years. 

Friday, January 17, 2014

Valuation

Earnings valuations on Wall Street for 2014 are right now falling in a range of $118-121 for the S&P 500.  Our work suggests a range of $117-120 for the year.  We will start with a mid-point of $118.75 to  and adjust as the year goes forward.  We will also start giving our four quarter forward guidance as the markets seem to be increasingly focused on that metric.  

I think we will see further evidence over the course of this year of economic acceleration in the US and developing economies around the world.  I also think that we will see stabilization in certain emerging markets by year end as well.  The 10 year Treasury bond trades with a 2.83% yield which I think could go up to 3.25-3.75% by year end with a 3.50% midpoint.  Given these hypotheses, I think it is possible that stocks could trade with a 15.5-16.5 PE on the overall market.   As such here are the metrics we are using on a going forward basis based on our earnings models.

Valuation @ $117 EPS, S&P 500 with a 15.5 PE:
1,1814-1,850 S&P 500, 2.10% Dividend Yield S&P 500, 6.4% EPS Yield.

Valuation @ 118.75 EPS, S&P 500 with a 16 PE:
1,900-1,950 S&P 500, 1.95% Dividend Yield S&P 500, 6.2% EPS Yield.

Valuation @ 120 EPS, S&P 500 with a 16.50 PE:
1,980-2,050 S&P 500, 1.85% Dividend Yield S&P 500, 5.9% EPS Yield.

Best Guess Scenario:
1,925 S&P 500 1.95% Dividend Yield, 6.22% EPS Yield.

One other point.  Probability analysis leads me to think that we will see at least one decline this year in the market in the 10-20% range.  It's been a long time since we've seen something like this.  Probability suggests that since normal market volatility is somewhere close to 10%, it is reasonable to suggest  that we could revert to the mean at some point this year.

Markets are closed Monday in celebration of Martin Luther King Day.  Our next post will be Tuesday.

*Note:  The above valuation assumptions are a series of probabilities  & not guarantees.  We do this exercise to help us with our framework in developing an investment view for the next 12 months.  Nothing here should suggest that any of these scenarios will in fact come to fruition.  It is entirely possible that stocks could do something completely different than what we have shown above including showing losses over the next year.  Do not use these assumptions without doing your own homework, discussing these scenarios with your advisor or better yet hiring us!

**Long ETFs related to the S&P 500 in client and personal accounts.

Wednesday, January 15, 2014

an tSionna {01.15.14}


Chart of the S&P 500 ETF SPY.  The Chart comes to us from FINVIZ.com.  The chart shows the market's directionless so far this year, although as I'm writing this the market is flirting with new highs for 2014.  

Stock's trading this year is different from 2011-2013 when we started out strong from the gate.  Then again we didn't see the massive kinds of gains in any of those previous years that we saw in 2013.  Stocks also were pretty undervalued back then and it's hard to make that case now.  I'm not in the doom and gloom camp for 2014.  As I'll detail in a future post  I think stocks could potentially see gains in the 4-10% range this year.  But probability suggests we might see more of a 1 step forward two steps back type of market, especially in the first half of the year.  Probability also suggests that we'll see at least one correction in the 10% plus camp this year.  That's something you have to go back to the spring of 2012 to have seen and the last correction of any real heft was in in the summer of 2011.  Again hopefully I'll be able to go into more detail on this in a future post.

I will be out tomorrow at meetings so the next post here will be Friday.

*Long ETFs related to the S&P 500 in client and personal accounts.  

Tuesday, January 14, 2014

Market's Sluggish Start

Markets are off to a slow start in 2014.  In one sense this should really not be much of a surprise.  Stocks rallied nearly 3.5% in the last two weeks of 2013 and a large part of that had to have been end of the year portfolio dressing.  Remember it's the last print of the year on which Wall Street gets paid.  

Still the sluggishness that has greeted us in January is a far cry from how 2013 started.  Bespoke Investment Group has taken a look at sector performance so far this year vs 2013.  Here's the chart.  


Health care was the big winner last year and is shining so far in 2014.  Energy and materials which severely lagged the markets are continuing that trend.

I think it's a tad early to try and draw to many trends for this year from the first two weeks of market performance because of that big run up at the end of the year.  Still, valuations remain somewhat problematic.  I'm going to try and address the probabilities of market returns in a post later this week.


*Long ETFs related to the S&P 500 in client and personal accounts.  Long ETFs related to energy in client and personal accounts.  Long ETFs related to materials in certain client accounts.  I have specifically listed in this disclosure positions in sectors I've highlighted in this post.  However, we are also long various other indices related to the sectors shown above in certain client and personal accounts.  

Monday, January 13, 2014

Hedge Funds Mimic the S&P 500


I guess we're not done picking on hedge funds quite yet.  Business Insider.com shows how hedge funds have increasingly been mimicking the S&P 500.  Here's their commentary.

Generally speaking, most hedge funds will try to offer superior returns or stable returns in any market. But according to {the chart above} from Morgan Stanley's Adam Parker, "hedge funds in aggregate are essentially long the S&P 500."
The chart {above} shows the correlation between the S&P 500 and a broad equity hedge fund e index. The closer a correlation is to 1, the more the two things are in sync. The difference here is that you can buy an index mutual fund with expenses that are a fraction of a fraction of a percent, whereas a hedge fund will charge you 2% then take another 20% of your profits.
Of course, not all hedge funds are the same.  And perhaps that's why investor will always make bets on the low probability that they've found the fund manager who can beat the market.
My thoughts:  The very name "hedge fund" implies an asset allocation strategy that attempts to take advantage of opportunities in many different parts of the markets, including the short side.  With that in mind, investors should expect in a year like last {when the markets were off to the races} that hedge funds in aggregate would under perform the markets.  Yet according to Bloomberg, hedge funds have now underperformed the markets for five years in a row.  This is a long enough period for eyebrows to be raised as it encompasses everything from flat markets, rising bullish environments and periods were the markets declined double digits.  I think there are too many hedge funds cashing too few ideas and that many managers carry more about the 2 plus 20 fee structure than operating as the funds were  originally designed to be.
*Long ETFs related to the S&P 500 in client and personal accounts.


Friday, January 10, 2014

Average Investor's Returns {20 Years}

See graph below for the number one reason most investors should hire an outside manager to invest for them.


The graph from Business Insider and attributed by them to Bob Doll of Nuveen Investments, shows 20 year annualized returns by asset class.  Note that even through all the gyrations we've seen in stocks over the past ten years, equities have still returned nearly 8% annualized.  Also note that the average investor has seen a fraction of that return.  Investors it seems still have the unfortunate habit of moving into and out of investments at the wrong times.  

Link:  Business Insider: Reminder: You are Terrible at Investing.

Thursday, January 09, 2014

Hedge Fund Returns {Not A Thing Of Beauty!}

From Bloomberg:

"Hedge funds trailed the Standard & Poor's 500 Index {SPX}for the fifth straight year as U.S. markets rallied to record levels.  Hedge funds returned an average of 7.4 percent in 2013, after a gain of less than 0.1 percent in December. The Bloomberg Hedge Funds Aggregate Index is down 1.8 percent from its July 2007 peak. The index is weighted by market capitalization and tracks 2,257 funds, 1,264 of which have reported returns for December.  Funds lagged behind the S&P 500 by 23 percentage points last year, the most since 2005, as the U.S. benchmark surged 30 percent for its best performance since 1997."  
Look I know that hedge funds along with most asset allocation strategies will trail the US markets in a year when the melt up like 2013.  But I believe when you're charging your clients a 2% management fee plus 20% of the profits that the investors deserve better than that!  I think you're going to start to see pressure on fees in the hedge fund universe if this keeps up.
*Long ETFs related to the S&P 500 in client and personal accounts.

Wednesday, January 08, 2014

Asset Class Returns


JP Morgan puts out an excellent quarterly report that covers a wide range of topics from stocks and bonds to the economy.  It's 4th Quarter Guide to the Markets can be found here.  This chart comes from page 58 of that report and shows returns across various asset classes. You can double click on the graphic to make it larger. An equal weighting to all ten asset classes listed in 2013 would have given you a return of 10.64%.  The equal weighted return of the nine asset classes excluding the asset allocation portfolio would have returned 10.16%.  

Tuesday, January 07, 2014

Last Year's Scorecard


ETF investment matrix from Bespoke Investment Group and can be linked here.  {Double clicking on the chart will make it bigger and easier to see.}

A couple of observations.  

1. US stock related ETFs did very well last year.  The S&P 500 ETF was up 29.69% The Rydex S&P 500 equal weighted index performed better.  It was up 33.63%.  {RSP is one of our largest investments.} 

2. As did some unexpected sectors.  Notice that consumer discretionary was the best performing sector in 2013 followed closely by health care.  Common sense would have thought that if the consumer was as hard up as people thought there wouldn't have been the money to propel discretionary higher.  They fight over the Affordable Care Act would have led you to believe that health related ETFs should have struggled.

3.  Fixed income did struggle.  You know I think bonds are lousy investments.

4.  Emerging markets had a dismal year.  Markets that were huge commodity producers didn't fare much better {See  Australia}.  Commodities and in particular gold and silver were taken out and shot.

5.  Europe did much better than pundits predicted.  While it isn't shown on the chart, Europe as represented by the Vanguard FTSE Europe ETF {VGK} was up 24.38% last year. {Source Morningstar.}

*Long ETFs related to the S&P 500 and RSP in client and personal accounts.  Long XLV and XLY in certain client accounts.  Long certain ETFs related to international, emerging markets and VGK in client and personal accounts.  Long GLD in certain client accounts.  We are also long many of the different ETFs on the list above.  I have mentioned specifically those that I highlighted.    


Monday, January 06, 2014

Cone of Probability.

You've heard me in the past use the term the Cone of Probability or probability cone.  It's a term I've borrowed from meteorology, particularly in the study of hurricane forecasting.  In meteorology it refers to the probable path a hurricane can be expected to take and has a wide margin of error the further in the future the forecast looks out.  We use it when doing valuation analysis.  Here is our definition of this term. 

The Cone of Probability is our current assessment of the trading range within which we think stocks have the potential to trade during the described time period.  It is a probabilistic assessment based on a many factors.  Some of these inputs are: Earnings estimates, and whether those estimates are rising or falling, dividend yield, earnings yield and the current yield on the US 10 year treasury.  This is not an exhaustive list of all of the variables that are used in creating the cone.  The Cone of Probability is used solely for analytical purposes.  It will fluctuate with market conditions and changes to the data inputs.  Index prices can and have traded outside of the range of the cone.  The data supplied when we discuss the cone is for informational use only.  There should be no expectation that this price range will be accurate and there are no guarantees that this information is correct.

Posting Issues

From Chicago where I think the high today was something like -9!  Cold weather is causing havoc with  the internet grid.  Have several things I'd like to put up but can't seem to get very far in doing that.  I'll get to it just as soon as Old Man Winter gives us a break!  When the internet lines thaw out around here, we're going to spend some time this week reviewing how various parts of the market did in 2013.

Solas: The Introduction.

Solas!


Hello and Welcome! At least once a year I will try to republish the introduction to this blog and my general disclaimer..

As stated way back when, this is an experiment and Solas! so far seems to me to be the best opportunity to focus on what I want to write in a time efficient and hopefully interesting manner. However, please keep in mind that so far this is a hit or miss experiment. I don't yet know if this is going to work, how it's going to look or even if I am going to be satisfied with the end product. As a work in progress, especially at its inception, this may be a hit or miss endeavor. I don't know how and may never have time to do many of the things that make this look pretty or more professional. Nor am I going to take time away from my business to become an expert blogger. I do over time hope to make this better. I welcome your comments and suggestions.

What this is:

A learning experience. A way for me on occasion to make a point.

A way for me on occasion to discuss markets and investing.

A place for me on occasion to discuss the vagaries of life and perhaps editorialize.

A place to discuss the investment process.


What this is not:

A forum to tout any form of individual investments. (Particularly individual stocks or ETFs). We do not make recommendations on this blog! If we do discuss individual sectors or securities it will be solely in the context of a learning experience. You should understand that any individual sector or security that may be discussed here has the possibility of loss of principal.

A place for me to give individual investment advice. (Call me or others for this).

A theatre for me to tell you how wonderful I am.

An environment for me to make stock valuation claims i.e. "XYZ is worth 50 dollars!" If & when we do discuss valuations, that will be an opinion and nothing there should be construed as a guarantee of return or a guarantee that a stock will ever trade to an actual price.

And anything else that I might think of going forward.

One other thing. Where I discuss any individual security I will disclose whether I or clients currently own that stock or ETF. That disclosure is only valid for the day of the post as investments can change at any time. Any person who reads this blog and is not a client of Lumen Capital Management, LLC should either do their own research, give us a call or talk to their own investment advisor before making any investment based on anything written within the confines of this blog.

Oh and a final disclaimer!!! I write principally for the clients and friends of my firm, Lumen Capital Management, LLC. It is a way for them to get a quick read on my thoughts about the markets and any other subject I might cover. I do so after understanding to the best of my ability their unique risk/reward criteria. As such any casual or outside reader of this blog should understand that I am not writing for them! Therefore I or my firm takes no responsibility for any actions overt or otherwise a casual reader of this blog might take based on our discussions here. Casual or outside readers should do their own homework, discuss our articles with their own investment advisors or better yet hire us.

In short if you're not a client and you read this you're on your own.